The aim of the 'named points' node and associated domain is to provide better support for drawing graphs (that is 'graphs' as in graph theory) and diagrams of trees, latices and category theory arrow diagrams. In other words, diagrams with named nodes and arrows or lines between these nodes.
These diagrams can already be drawn, using this graphics framework without this feature, however this requires that the coordinates are supplied for each end of each line or arrow. If we want to stop the arrow short of the nodes, to avoid overwriting the node name, then the new coordinates would have to be recalculated using boilerplate code.
So the aim is to separate the mathematical structure of the diagram from the actual coordinates and issues of making the diagram more human readable. Eventually we might also have some intelligent code that places the node positions to minimise crossing the arrows and so on.
For example, imagine we wanted to add support for graph theory in FriCAS (as here) then we could implement a GraphTheory domain and it might contain a 'draw' function to draw the graph to a SVG file. This code will have a set of node names, say "a","b"... and the 'draw' function will draw the appropriate arrows between them, however we don't want the code to be cluttered up with specific coordinates so we put all that in a 'named points' node (here called np). We can then then draw the arrows thus:
| addSceneArrow(np,"a","b".... |
Tutorial
We can create a 'named points' domain to hold a list of names and the points they map to:
(1) -> PT ==> SCartesian(2)
                                                             Type: Void

(2) -> ptin:List PT := [sipnt(100,100)$PT,_
                                   sipnt(100,200)$PT,sipnt(200,200)$PT]
   (2)  [pt(100.0,100.0),pt(100.0,200.0),pt(200.0,200.0)]
                                              Type: List(SCartesian(2))

(3) -> nmin: List String := ["a","b","c"]
   (3)  ["a","b","c"]
                                                     Type: List(String)

(4) -> namedPts: SceneNamedPoints PT := namedPoints(ptin,nmin)
   (4)  pt:"a":pt(100.0,100.0),"b":pt(100.0,200.0),"c":pt(200.0,200.0)
Type: SceneNamedPoints(SCartesian(2)) |
We can then use this 'named points' domain in the scene like this:
(5) -> view := boxBoundary(sipnt(0,0)$PT,sipnt(1000,1000)$PT)
(5) bound box:pt(0.0,0.0)->pt(1000.0,1000.0)
Type: SBoundary(SCartesian(2))
(6) -> sc := createSceneRoot(view)$Scene(PT)
(6) scene root bound box:pt(0.0,0.0)->pt(1000.0,1000.0) #ch=0
Type: Scene(SCartesian(2))
(7) -> np := addSceneNamedPoints(sc,namedPts)$Scene(PT)
(7)
scene namedpoints n=
pt:"a":pt(100.0,100.0),"b":pt(100.0,200.0),"c":pt(200.0,200.0)
#ch=0
Type: Scene(SCartesian(2))
(8) -> nt := addSceneText(np,["a","b","c"],12::NNI,sipnt(50,50)$PT)
(8) scene text="a" sz=12 p=pt(50.0,50.0) npt=["a","b","c"] #ch=0
Type: Scene(SCartesian(2))
(9) -> a1 := addSceneArrow(np,"a","b",_
sipnt(50,50)$PT,"fixed"::Symbol,2.0::DoubleFloat)
(9) scene arrows str="a" ena="b" ofs=pt(50.0,50.0) md=fixed sz=2.0 #ch=0
Type: Scene(SCartesian(2))
(10) -> a2 := addSceneArrow(np,"b","c",_
sipnt(50,50)$PT,"fixed"::Symbol,2.0::DoubleFloat)
(10) scene arrows str="b" ena="c" ofs=pt(50.0,50.0) md=fixed sz=2.0 #ch=0
Type: Scene(SCartesian(2))
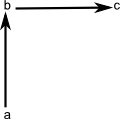
(11) -> writeSvg(sc,"testGraph/examplenamed.svg")
Type: Void |
 |
Further Information
- User Reference on this page.
- Programmers Reference on this page.
- Examples of scenegraph structure on this page.
- The code is in file: scene.spad.pamphlet which is available from here.
- Existing Axiom graphics framework on this page.