This is a graphics framework to support many types of drawing, plotting, diagrams and various types of output that can't be represented as text only.
This code is intended to support all types of graphical output that could be required by mathematical programs, this includes,
- Plotting functions in various dimensions.
- Grids and axis for such plots.
- Graph theory diagrams
- Geometric Shapes
- Vector diagrams
- Action of transforms on structures.
- Force fields.
These are just examples, since the code is intended to be as general purpose as possible. The code is not intended to edit or render these graphical structures but rather to output to various file types where they can be edited and rendered by widely available graphics editors which are much better at that task.
This is similar to text output from Axiom/FriCAS which uses an intermediate 'OutputForm' which knows enough about the mathematical structures to be able to format them in various ways but avoids the need for each individual structure to know about every type of output that may be required. In a similar way for graphics, this 'Scene' code is an intermediate format that knows about mathematical structures like functions, vectors, matrix, complex numbers, Clifford algebras, and so on but also knows about graphical stuff like points, lines, arrows, boundaries, surfaces, colours and so on.
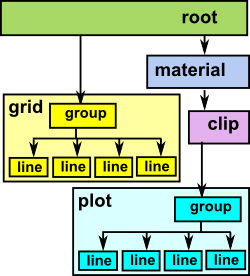
This is all structured as a 'scenegraph' which is a very common form for graphical programs and provides a very ordered way to structure our graphical information. This 'scenegraph' is a tree structure an example might be like the diagram below.
 |
I have put an introduction and tutorial to this code on these pages:
Original Axiom Graphics FrameworkThe code documentation about the existing graphics framework is a bit sparse so I have put some additional information on this page. |
This code is intended to be an alternative to the current Axiom/FriCAS graphics framework. It is based on a scenegraph structure which allows lines, surfaces and higher dimensional structures to be defined and modified by transforms, clipping boxes, material (line width, colour and so on) to be controlled for individual nodes or whole branches in the scenegraph. This means that, for example, transforms can be applied continuously to a whole branch without altering the nodes in that branch, this means that we can avoid a cumulative build up of floating point errors when many transforms are applied.
This framework supports all the 2D and 3D draw and plotting that the existing framework supports. Use of transforms in the scenegraph means that many plots can be combined together, either overlayed or next to each other and combined with various show scales, grids text annotations and so on.
The framework supports:
- Different algebras: vector, matrix, complex numbers and Clifford Algebra.
- Different geometries: Euclidean, projective, conformal, hyperbolic.
- Different coordinate systems: Cartesian coordinates, Argand Plane, Spherical, Cylindrical.
- Different number of dimensions: 2,3 (4 and more to be added)
The aim is not just to draw plots but also to allow experimentation with arbitrary shapes being transformed, for instance to transform a given shape by reflecting in a circle. To see the sort of thing I am trying to do here see first chapter of [Dorst,Fontijne & Mann 2007] except this is not just limited to Clifford algebra and conformal space.
In some ways it would be good to separate out pure geometry functions such as:
- Representing Points, Lines, Oriented Planes, Volumes and higher dimensional elements.
- Interactions between these such as intersection, projection, meet, join and so on.
- Transformations of these such as translation, rotation, reflection and so on.
- Normals to surfaces.
I think there is a distinction between the way we represent these infinite elements such a line that extends infinitely in both directions and a finite line that only extents between two points. It seems quite difficult to represent both of these in a common structure that is completely general. For infinite objects then Clifford/Grassmann algebra seems to provide a very efficient representation but for finite objects it is simpler to specify everything in terms of points.
Most drawing functions tend to be on finite objects so it seems to make sense to represent shapes in terms of points, for instance, a curved line would be approximated by a list of points linked by
straight lines.
So why do we need a graphics and drawing framework in a CAS? It would be good if we could use other software to provide this capability for us. However we need to express these graphics
functions in terms of various types of algebras such as Clifford algebra and general purpose graphics packages can't do that. It would be good if FriCAS could be extended at some stage in the future to allow the user much better graphical interaction with the program. This would require even tighter interaction between the algebra, geometry and graphics aspects of the program.
This code is intended to be an alternative to the current Axiom/FriCAS graphics framework. It is based on a scenegraph structure which allows lines, surfaces and higher dimensional structures to be defined and modified by transforms, clipping boxes, material (line width, colour and so on) which control individual nodes or whole branches in the scenegraph. This means that, for example, transforms can be applied continuously to a whole branch without altering the nodes in that branch, this means that we can avoid a cumulative build up of floating point errors when many transforms are applied.
The old Axiom/FriCAS graphical code has domains that represent transforms: (for example: dhmatrix.spad.pamphlet, moebius.spad.pamphlet and so on) but they are just standalone domains which don't fit into a wider graphics framework so it is more difficult to combine them with other things and to experiment. The aim of this framework is to create a way for geometry and graphics related entities to interwork.
This scenegraph framework currently exports to file formats like: SVG,X3D, VRML and Wavefront(obj) but currently there is not the capability to interact directly in a graphical way, that is, there is no xwindow support. The existing graphics framework allows user interaction in a very limited way in that the graphics can be displayed in an xwindow and there is then the ability to do simple transforms like pan and zoom. However this is not suitable for the new framework because the existing framework builds a data structure to represent the graphics using SPAD and then passes this to 'C' code. The 'C' code then does the pan, zoom and so on and can then save to a file format.
Code and Documentation
If you would like to try out this code then I have put it into the file: scene.spad.pamphlet
which is available from here: http://github.com/martinbaker/multivector
Introduction and Tutorial
I have put an introduction and tutorial to this code on these pages:
- User Tutorial on this page.
- Tutorial2 - conformal space.
- User Reference on this page.
- Programmers Reference on this page.
- Examples of scenegraph structure on this page.
Existing Axiom Graphics Framework
The code documentation about the existing graphics framework is a bit sparse so I have put some additional information on this page.